1 Background and History of Analytic Methods
By: Nancy Krieger PhD, Dena Javadi
In 2004, a team based at the Harvard T.H Chan School of Public Health’s Department of Social and Behavioral Sciences published a Project Monograph describing the motivation behind the Public Health Disparities Geocoding Project and its analytic approaches, both conceptually and methodologically. The monograph dove into methods of geocoding, generating area-based social metrics (ABSMs), Multi-level Modeling, data visualization, and basic epidemiologic methods for generating descriptive statistics, with the intent of providing population health scientists, health department staff, cancer registries, policy makers, and advocates and activists for health justice with tools to put on the map – literally – rampant but underreported socioeconomic inequities in health and their links to racialized and spatial health inequities (Krieger et al, 2005; Krieger, 2009).
Key publications on these topics can also be found on the project’s publications page.
The Public Health Disparities Geocoding Project is informed by the ecosocial theory of disease distribution, developed by Dr. Nancy Krieger in 1994, specifically “its focus on how people literally biologically embody their societal and ecological context at multiple levels, across the life course and historical generations” (Krieger, 2012).
Administrative health data, disease surveillance systems, and routine health surveys are important tools in understanding disease distribution and informing public health programming, advocacy, and policy development. However, the social patterning of disease distribution is often obscured by a lack of robust social metrics, including socioeconomic data, pertinent to understanding health inequities - defined as unfair, avoidable, and preventable health differences across social groups (Krieger, 2011). These social groups, co-defined by social relationships involving power, are among the many groups which together comprise the “populations” that embody health, experience health injustice (or health justice), and are the focus of public health monitoring, research, and action. As defined by Krieger (2012), “populations are dynamic beings constituted by intrinsic relationships both among their members and with the other populations that together produce their existence.” Addressing health inequities across social groups and within populations accordingly requires data on the population-defined and defining relationships and characteristics that create and are created by structures and systems. Further, theories of disease distribution and the underlying agendas, ideologies, and motivations contributing to their implicit or explicit use in turn shape what data get analyzed, how the analysis is interpreted, and what visualizations are used to disseminate findings (Krieger, 2011). Misuse or poor use of data analysis and visualization tools can contribute to obscuring health inequities, leaving out certain subpopulations or misrepresenting trends in disease distribution, resulting in poor policy decisions and inadequate or misleading data to inform community and advocacy organizing for health justice. Therefore, not only is the availability of robust health information systems important, so too is the use of appropriate methods and a health equity lens in their analyses.
Using routine information systems to inform disease prevention is not a 21st or even 20th century concept. In 1829, William Farr, a “Compiler of Abstracts” at the General Register included a letter to the Register’s first report which stated that
“Diseases are more easily prevented than cured, and the first step to their prevention is the discovery of their exciting causes. The Registry will show the agency of these causes by numerical facts and measure the intensity of their influence and will collect information on the laws of vitality with the variation in these laws in the two sexes at different ages and the influence of civilisation, occupation, locality, seasons and other physical agencies whether in generating diseases and inducing death or in improving the public health” (Whitehead, 2000).
In the US, linking of public health data to US census-based socioeconomic data was carried out by the National Tuberculosis Association in the 1920s and 1930s (Green, 1932; Nathan, 1932). Similarly, cancer epidemiologists have used geocoded data to generate and stratify cancer incidence, categorizing social groups using variables defined in relation to “race/ethnicity,” sex, and socioeconomic position, for many decades (Krieger, 2001). Of note, US health data have long been reported by US government agencies (federal, state, and local) stratified by “race” and “sex,” informed by a long history of biological essentialism that treats these variables as a matter of innate biology, with no attention to inequitable racial, gender, or class relations (Krieger, 2021; Hunter et al, 2005). Adding socioeconomic data to the mix can aid with understanding the contribution of socioeconomic inequities to racialized and gender health inequities, but with the caveat that the 20th century CE framework of eugenics (whose shadow continues to be cast well into the 21st c CE) also has held that people’s socioeconomic position reflects their genetic inheritance (Krieger, 2018; Levine, 2017).
Despite these early emphases on social metrics as critical in understanding inequitable and differential population rates and distributions of morbidity and mortality, the integration of socioeconomic data in national surveillance systems has been slow. A recent OECD report on national monitoring systems for health inequalities by socioeconomic status found that only seven of the 26 high-income countries included in the study had national routine monitoring systems with regular reports on socioeconomic inequalities in health over time (Frank and Matsunaga, 2020).
When the first Public Health Disparities Geocoding Project was launched, it presented a solution in the form of area-based socioeconomic measures (ABSMs) where multilevel approaches to understanding area-based measures, classified by socioeconomic characteristics, could be used to calculate stratified rates and render the invisible, visible. The project articulated the lack of a standardized approach in the choice of geographic levels and types of ABSMs used for monitoring disease distribution, making comparison across heterogeneous methods difficult.
The project took on the task of identifying which ABSMs would be most apt for monitoring socioeconomic inequalities in health and at what geographic level. Findings suggested that census tract poverty level - defined as “percent of persons below poverty” - was most apt (Krieger et al, 2003).
Since then, there has been significant development in both the conceptualization of geocoded health disparities, types of ABSMs, and the technologies available to capture, analyze, and visualize them.
Many ABSMs have been developed around the world. Globally, the Gini coefficient is one of the standards for measuring income inequality (with caveats around its use beyond larger aggregations and issues around spatial social polarization) (Shaw et al, 2007; Krieger et al, 2016). In Canada, examples include the Socioeconomic Factor Index (SEFI), the General Deprivation Index (GDI), and the Deprivation Index for Health and Welfare Planning for Quebec (DIHWPQ) (Schuurman et al, 2007). Starting in the early 20th c CE, the UK began using the Registrar General’s social class classification systems (an ad hoc approach based on skill-level demarcations in occupational class), which in was replaced in 2000 by the theoretically-grounded National Statistics Socio-economic Classification (NS-SEC), which emphasizes employment relations and the conditions of occupations (UK Office of National Statistics, 2022). Also commonly used is the English Index of Multiple Deprivation (McLennan et al, 2019). In the US, studies have generated or used composite indices of deprivation or social vulnerability based on selected census variables (O’Campo et al, 2008; Messer et al, 2006; Hu et al, 2021; ATSDR 2022).
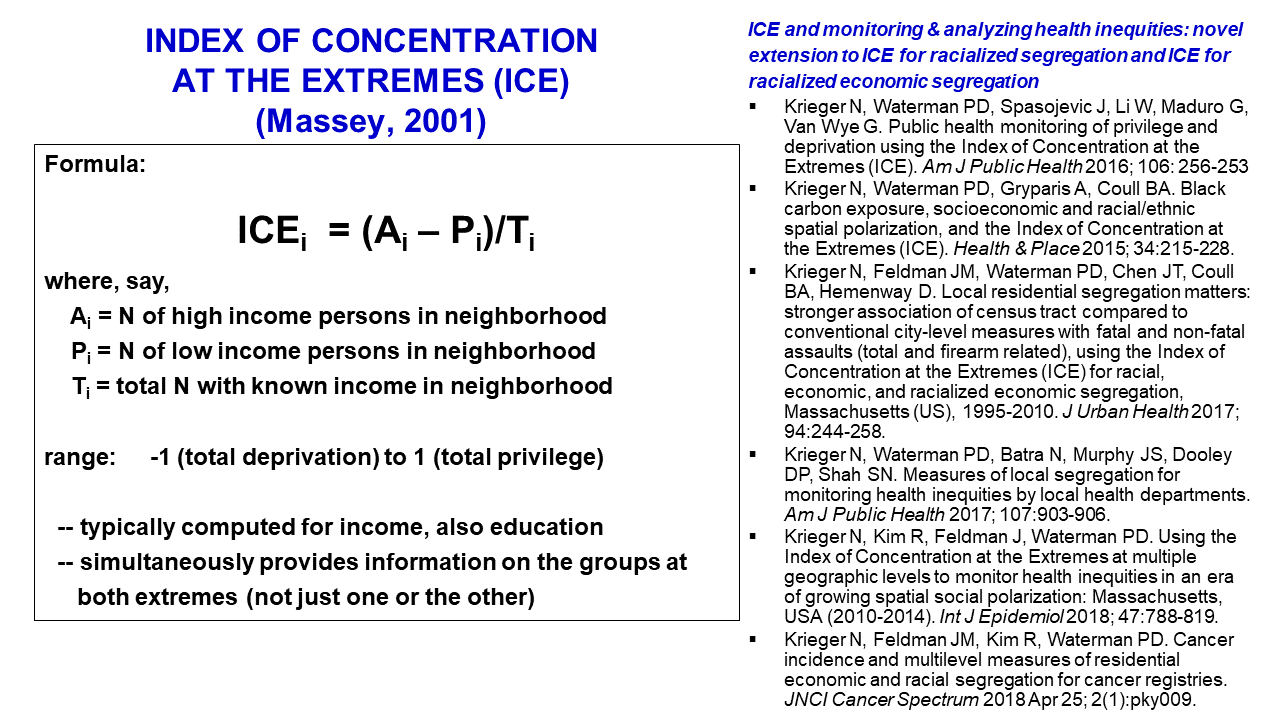
However, one problem common to many indices, and also single-variable measures (such as percent below poverty), is that they do not provide insight into the power relations and spatial social polarization driving health inequities (Krieger et al, 2016; Krieger et al, 2017). For example, the metric “percent below poverty,” while useful for describing socioeconomic gradients in health, notably provides no information on the income distribution of those “above poverty,” which can range from barely above poverty to extremely affluent. Similarly, a commonly used variable in the US, such as “percent of population classified as being Black Americans” says nothing about the distribution of other racialized groups and the social relationships that are core to racialized economic segregation. An additional problem is that diverse metrics intended to measure inequality across the full population distribution, such as the Gini coefficient or the dissimilarity index (which measures the proportion of a population that would need to move within a geographic area to achieve evenness of distribution), is that they are only meaningful at higher geographic levels (Krieger et al, 2016; Krieger et al, 2017). At issue is how, within the US, policies and practices, past and present, to generate and enforce racialized economic segregation have worked to buttress neighborhood boundaries, especially to keep some areas White and affluent and relegate lower-income populations, disproportionately Black, Latinx, Indigenous and immigrant in the US to underdeveloped neighborhoods lacking resources for people to thrive (Krieger et al, 2016; Krieger et al, 2017; Rothstein, 2017; Bailey et al, 2017).
A new approach to capturing the extreme range of concentrations of economic deprivation and privilege, termed the “Index of Concentration at the Extremes” (ICE), was developed in 2001 by Douglass Massey, a leading US scholar on residential segregation (Massey, 2001; Massey, 1996; Massey, 2012). This measure, which ranges from -1 to 1 and captures the extent to which an area’s population is concentrated into one end of the other of extremes of privilege and deprivation, notably can be used meaningfully at multiple levels of geography, from census block on up to counties and higher. In recent years, members of our Public Health Disparities Geocoding Project team have produced work promoting use of the ICE in public health research, and also extending Massey’s original work to develop ICE measures that quantify not only racialized residential segregation but also racialized economic segregation, with the latter comprising the first metric of its kind (Krieger et al, 2016; Krieger et al, 2016B; Scally et al, 2018; Krieger et al, 2018; Chen & Krieger, 2021; Krieger et al, 2015). The intent is to provide insight into who and what drives health inequities, not just focus solely on those harmed (Krieger et al, 2010; Beckfield, 2018; Bambra et al, 2021; Bailey et al, 2017).
The Covid-19 pandemic - due to the social and geographic patterning in the spread of the virus and associated hospitalizations and deaths - has highlighted the critical need for improved surveillance systems and systematic monitoring of health inequities (Presidential Task Force, 2021; Bambra, 2021). As a result, the Public Health Disparities Geocoding Project has compiled resources to support efforts in carrying out the analyses of health inequities in this context (Krieger, Chen, Waterman, 2020).
The 2020 update to the project, shared in May 2020 in the thick of the first months of the pandemic, provides:
List of conceptual and empirical publications
List of variables constructed using the US Census American Community Survey (ACS) data
R code for extracting ABSMs from the ACS and replicating analyses in the published empirical papers
The Public Health Disparities Geocoding Project 2.0 training (held online in June and July 2022) and now available through this manual builds on the work of our team throughout the pandemic and is offering an updated and revised training on why & how to analyze population health and health inequities in relation to census tract, county, and other georeferenced societal and environmental data. Because the area-based metrics we employ in this study include diverse social metrics, no longer restricted solely to economic measures, we employ the updated terminology of “area-based social metrics” – which we continue to abbreviate as “ABSMs.”
This online manual will walk through each step of the training including:
Chapter 2: Getting Set Up
Chapter 3: Getting your Data
Chapter 4: Visualizing your Data
Chapter 5: Analyzing your data
Chapter 6: Case Study - Premature Mortality
Chapter 7: Case Study - Breast Cancer Mortality
Chapter 8: Case Study - Cook County Covid-19
Chapter 9: Case Study - Temporal Trends using American Community Survey (ACS) data (2012-2019)
Chapter 10: Case Study - Comparing County Analyses of Inequities in Health Insurance using ACS vs. CDC PLACES data (2019) Survey
Chapter 11: Conclusions
We hope that this resource is of use to you. If you have questions or comments, please reach out to: geoproj@hsph.harvard.edu
REFERENCES
Agency for Toxic Substances and Disease Registry (ATSDR). CDC/ATSDR Social Vulnerability Index. https://www.atsdr.cdc.gov/placeandhealth/svi/index.html ; accessed June 14, 2022.
Bailey ZD, Krieger N, Agénor M, Graves J, Linos N, Bassett MT. Structural racism and health inequities in the USA: evidence and interventions. Lancet. 2017 Apr 8;389(10077):1453-1463. doi: 10.1016/S0140-6736(17)30569-X.
Bambra C, Lynch J, Smith KE. The Unequal Pandemic: COVID-19 and Health Inequalities. Bristol, UK: Policy Press, University of Bristol, 2021.
Beckfield J. Political Sociology and The People’s Health. New York: Oxford University Press, 2018.
Chen JT and Krieger N. Revealing the unequal burden of COVID-19 by income, race/ethnicity, and household crowding: US county versus zip code analyses. Journal of Public Health Management and Practice. 2021; 27(1), pp.S43-S56.
Frank JW and Matsunaga E. National monitoring systems for health inequalities by socioeconomic status–an OECD snapshot. Critical Public Health. 2020; pp.1-8. doi: 10.1080/09581596.2020.1862761
Green HW. Tuberculosis and economic strata, Cleveland’s Five-City Area, 1928-1931. Cleveland, OH: Anti-Tuberculosis League, 1932.
Hu J, Bartels CM, Rovin RA, Lamb LE, Kind AJH, Nerenz DR. Race, Ethnicity, Neighborhood Characteristics, and In-Hospital Coronavirus Disease-2019 Mortality. Med Care. 2021 Oct 1;59(10):888-892. doi: 10.1097/MLR.0000000000001624. 1.
Hunter E, Friedman D, Parrish R (eds). Health statistics : Shaping policy and practice to improve the population’s health. New York ; Oxford: Oxford University Press, 2005.
Krieger N. Epidemiology and the web of causation: has anyone seen the spider? Soc Sci Med. 1994 Oct;39(7):887-903. doi: 10.1016/0277-9536(94)90202-x.
Krieger, N. Socioeconomic data in cancer registries. Am J Public Health. 2001; 91(1), p.156.
Krieger, N. Chen, J.T., Waterman, P.D., Rehkopf, D.H. and Subramanian, S.V. Race/ethnicity, gender, and monitoring socioeconomic gradients in health: a comparison of area-based socioeconomic measures—the public health disparities geocoding project. Am J Public Health. 2003; 93(10), pp.1655-1671.
Krieger N, Chen JT, Waterman PD, Rehkopf DH, Subramanian SV. Painting a truer picture of US socioeconomic and racial/ethnic health inequalities: the Public Health Disparities Geocoding Project. Am J Public Health. 2005 Feb;95(2):312-23. doi: 10.2105/AJPH.2003.032482.
Krieger N. Putting health inequities on the map: social epidemiology meets medical/health geography––an ecosocial perspective. GeoJournal. 2009 Apr;74(2):87-97.
Krieger N, Alegría M, Almeida-Filho N et al. Who, and what, causes health inequities? Reflections on emerging debates from an exploratory Latin American/North American workshop. J Epidemiol Community Health. 2010;64(9):747–749.
Krieger N. Epidemiology and The People’s Health: Theory and Context. New York: Oxford University Press, 2011.
Krieger N, 2012. Who and what is a “population”? Historical debates, current controversies, and implications for understanding “population health” and rectifying health inequities. The Milbank Quarterly, 90(4), pp.634-681.
Krieger N, Waterman PD, Gryparis A, Coull BA. Black carbon exposure, socioeconomic and racial/ethnic spatial polarization, and the Index of Concentration at the Extremes (ICE) Health Place. 2015;34:215–228.
Krieger N, Waterman PD, Spasojevic J, Li W, Maduro G. and Van Wye, G. Public health monitoring of privilege and deprivation with the index of concentration at the extremes. Am J Public Health. 2016; 106(2), pp.256-263.
Krieger N, Singh N, and Waterman PD. Metrics for monitoring cancer inequities: residential segregation, the Index of Concentration at the Extremes (ICE), and breast cancer estrogen receptor status (USA, 1992–2012). Cancer Causes & Control. 2016B; 27(9), pp.1139-1151.
Krieger N, Feldman JM, Waterman PD, Chen JT, Coull BA, Hemenway D. Local Residential Segregation Matters: Stronger Association of Census Tract Compared to Conventional City-Level Measures with Fatal and Non-Fatal Assaults (Total and Firearm Related), Using the Index of Concentration at the Extremes (ICE) for Racial, Economic, and Racialized Economic Segregation, Massachusetts (US), 1995-2010. J Urban Health. 2017 Apr;94(2):244-258. doi: 10.1007/s11524-016-0116-z.
Krieger N, Feldman JM, Kim R, and Waterman, PD. Cancer incidence and multilevel measures of residential economic and racial segregation for cancer registries. JNCI Cancer Spectrum. 2018; 2(1), p.pky009.
Krieger N. Inheritance and Health: What Really Matters? Am J Public Health. 2018 May;108(5):606-607. doi: 10.2105/AJPH.2018.304353.
Krieger N, Chen JT, Waterman PD. Using the methods of the Public Health Disparities Geocoding Project to monitor COVID-19 inequities and guide action for social justice. Available as of May 15, 2020 at: https://www.hsph.harvard.edu/thegeocodingproject/covid-19-resources/
Krieger N. Structural Racism, Health Inequities, and the Two-Edged Sword of Data: Structural Problems Require Structural Solutions. Front Public Health. 2021 Apr 15;9:655447. doi: 10.3389/fpubh.2021.655447.
Levine P. Eugenics: A Very Short Introduction. New York: Oxford University Press, 2017.
Massey DS. The age of extremes: concentrated affluence and poverty in the twenty-first century. Demography. 1996;33(4):395–412.
Massey DS. The prodigal paradigm returns: ecology comes back to sociology. In: Booth A, Crouter A, editors. Does It Take a Village? Community Effects on Children, Adolescents, and Families. Mahwah, NJ: Lawrence Erlbaum Associates; 2001. pp. 41–48.
Massey DS. Reflections on the dimensions of segregation. Soc Forces. 2012;91(1):39–43.
McLennan D, Noble S, Noble M, Plunkett E, Wright G, and Gutacker N. The English indices of deprivation 2019: technical report. 2019. https://www.gov.uk/government/statistics/english-indices-of-deprivation-2019. Accessed June 5th, 2022.
Messer LC, Laraia BA, Kaufman JS, Eyster J, Holzman C, Culhane J, Elo I, Burke JG, and O’campo P. The development of a standardized neighborhood deprivation index. Journal of Urban Health. 2006; 83(6), pp.1041-1062.
Nathan WB. Health conditions in North Harlem 1923-1927. New York: National Tuberculosis Association, 1932.
O’Campo P, Burke JG, Culhane J, Elo IT, Eyster J, Holzman C, Messer LC, Kaufman JS, and Laraia BA. Neighborhood deprivation and preterm birth among non-Hispanic Black and White women in eight geographic areas in the United States. Am J Epidemiology. 2008; 167(2), pp.155-163.
Presidential COVID-19 Health Equity Task Force. Final reportand recommendations. HHS, Office of Minority Health. https://minorityhealth.hhs.gov/omh/browse.aspx?lvl=2&lvlid=100. Updated November 10, 2021. Accessed June 14, 2022.
Rothstein R. The color of law : A forgotten history of how our government segregated America (First ed., Democracy and urban landscapes). New York ; London: Liveright Publishing Corporation, a division of W.W. Norton & Company, 2017.
Schuurman N, Bell N, Dunn JR, and Oliver L. Deprivation indices, population health and geography: an evaluation of the spatial effectiveness of indices at multiple scales. Journal of Urban Health. 2007; 84(4), pp.591-603.
Scally BJ, Krieger N. and Chen JT. Racialized economic segregation and stage at diagnosis of colorectal cancer in the United States. Cancer Causes & Control. 2018; 29(6), pp.527-537.
Shaw M, Galobardes B, Lawlor DA, Lynch J, Wheeler B, Davey Smith G. The Handbook of Inequality and Socioeconomic Position: Concepts and Measures. Bristol, UK: The Policy Press, 2007.
UK Office of National Statistics. The National Statistics Socio-economic classification (NS-SEC). https://www.ons.gov.uk/methodology/classificationsandstandards/otherclassifications/thenationalstatisticssocioeconomicclassificationnssecrebasedonsoc2010 ; accessed June 14, 2022.
Whitehead M. William Farr’s legacy to the study of inequalities in health. Bulletin of the World Health Organization. 2000; 78(1), p.86.